

12/21/2023
![]()
Identify and quantify different plastic compositions in the recycling stream
Dr. Omeir Khalid , Dr. Natalie Rudolph, NETZSCH Gerätebau GmbH
Plastics are part of our daily life in various ways. While technical parts are typically used for many years, the vast majority of packaging items are only used for days or weeks. At the same time, packaging applications make up around 50 % of the plastic production. Since plastics have a poor biodegradability but are a valuable resource even after their service life, focusing on recycling pathways is of utmost importance [1].
The majority of plastics used in packaging are polyolefins; namely PP and PE like HDPE, LDPE and LLDPE. Thus, a combination of these materials is found in our recycling streams. This poses a problem, because PE and PP are immiscible and incompatible both in molten and in solid state [2].
Nuclear Magnetic Resonance (NMR) and other fractionation methods (e.g., TREF, CRYSTAF, SSA) have been successfully used to differentiate the content of PP into its fractions, but these methods are expensive (time and investment) and require a high level of expertise. The most common identification tool, Fourier Transform Infrared (FT-IR), is easy to use and delivers fast results for the vast majority of plastics, but cannot differentiate between the HDPE, LDPE and LLDPE, for instance, due to their similarity.
Differential Scanning Calorimetry (DSC) has been proven to be suitable for the analysis of mixed plastic waste and recycled polyolefin blends [3-6]. It utilizes the thermal fingerprint of a material, which is, among other factors, determined by their backbone structure, molecular weight, side groups and branching. The significantly different melting temperatures of the materials can be used to identify the different components of a mixture, while their weight percentage is estimated based on the melting enthalpy. In many cases, the peak areas of PP and PEs found in such mixtures overlap, which requires that the peaks are being separated. For this purpose, a study on mixtures of HDPE-PP in various proportions was carried out using the PeakSeparation analysis in the Proteus® software.
In order to better define the analysis range of each overlapping peak, temperature-modulated DSC (TM-DSC) was used for refinement.
Experimental
Material
For this study, commercially available HDPE and PP were investigated in various proportions with a total mass of approximately 5 mg. The mixing ratios and sample designations are shown in Table 1
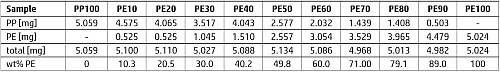
Tab.1: HDPE content of the samples. Nomenclature: PE90 = 90 wt% HDPE → 10 wt% PP
DSC
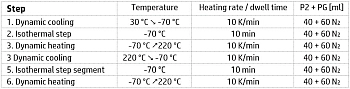
- Tab.2: Temperature program of the DSC experiments
on the HDPE-PP mixtures
The 1st cooling and heating segments were performed to erase thermal history of the polymer samples. The DSC signal during the 2nd dynamic heating step is used for compositional analysis. The TM-DSC measurement mode is employed to define the analysis range. The PeakSeparation function and the Identify database are used for identification and quantification.
PeakSeparation
The NETZSCH PeakSeparation function presents the experimental data as the additive superposition of peaks and allows separation of overlapped peaks using various types of editable profiles:
- Gaussian
- Cauchy
- Pseudo-Voigt (additional mixture of Gaussian and Cauchy)
- Frazer-Suzuki (asymmetric Gaussian)
- modified Labplace (double-sided rounded)
By applying these basic mathematical profiles to the measured curves, it becomes possible to mathematically separate the overlapping peaks. The algorithm looks for the peak para-meters, which gives the best minimal least square fit between simulated and experimental curve.
In this work, the overlaying melting peaks of HDPE and PP were separated with the help of the PeakSeparation function to determine and quantify their proportions in the total sample mass. Reasonable values of the melting enthalpies, which result from the areas between the DSC curve and its corresponding baseline, are obtained by the appropriate selection of the melting temperature range of HDPE and PP.
Identify
The Identify database, included in Proteus® software, is a unique package with currently about 1,300 entries on ceramics, metals, metallic compounds, polymers, as well as other inorganic and organic substances. This tool helps users identify and classify the materials measured with just a few clicks. In addition, there is an optional library with DSC measurements on 1,150 different polymer products (169 polymer types).
In this work, the Identify database is used to assign the peaks gained from PeakSeparation to the polymers present before quantifying their content in the measured samples.
TM-DSC
During a TM-DSC measurement, a periodical temperature modulation is applied over the conventional linear heating and cooling ramp. The total heat flow can thus be separated in a reversing and non-reversing component. The reversing component of the total heat flow is mainly related to the sample's heat capacity (as a material property) and the non-reversing component of the total heat flow is capturing irreversible phenomena such as recrystallization or crystal annealing.
Since melting processes show both a reversing and a non-reversing signal share, TM-DSC experiments were carried out on the pure HDPE and the PP samples in order to reveal the temperature range at which melting truly appears.
The TM-DSC experiments of the PP100 and PE100samples were performed according to the temperature and gas program for the mixtures shown in Table 2, whereas the heating segments were modified by using an additional amplitude of 0.5 K and a frequency of 0.05 Hz (20 s period) in order to generate the periodic temperature course.
Measurement Results
In Figure 1, the TM-DSC results of pure HDPE are shown. While the solid line represents the total DSC signal, the dotted and dashed lines reveal the reversing and non-reversing signal of the total heat flow, respectively. For HDPE, melting starts already at about 0°C as can be seen from the emerging non-reversing signal at this temperature (dashed line). In case of PP (see Figure 2), the non-reversing signal emerges at about 30°C.
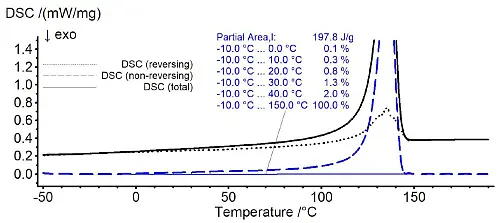
Fig.1: TM-DSC result for HDPE (PE100 sample) showing the average DSC signal with a solid black line, the reversing signal of the total heat flow with dotted black line and the non-reversing signal of the total heat flow with dashed blue line.
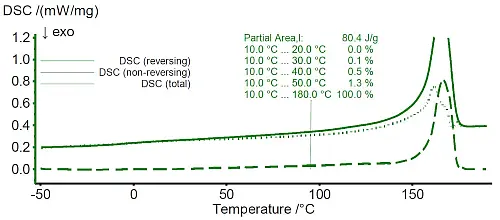
Fig.2: TM-DSC result for PP (PP100 sample) showing the average DSC signal with a solid green line, the reversing signal share with a dotted green line and the non-reversing signal share with a dashed green line.
In Figure 3, the DSC measurement of PE20 sample is shown with a black solid curve. The PeakSeparation function is applied (30°C to 190°C, linear baseline, 2 peaks with asymmetric shape) to reveal the blue curve which represents the PE component and the green curve at higher temperatures which represents the PP component. The red curve reflects the superimposition of both the blue and green curve as a fit function to the actually measured DSC signal (black curve).
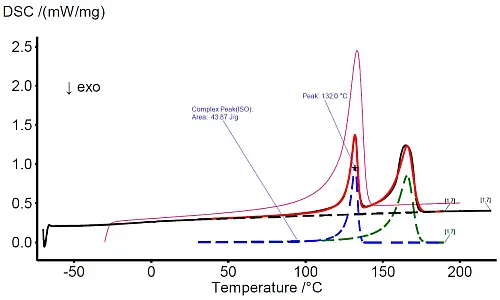
Fig.3: The red curve results from the superimposition of both the green and blue curves. The pink colored DSC curve represents the HDPE entry included in the Identify database.
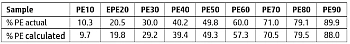
- Tab.3: HDPE content for the other blend compositions,
given in Table 1
In Figure 3, the DSC measurement of PE20 sample is shown with a black solid curve. The PeakSeparation function is applied (30°C to 190°C, linear baseline, 2 peaks with asymmetric shape) to reveal the blue curve which represents the PE component and the green curve at higher temperatures which represents the PP component. The red curve reflects the superimposition of both the blue and green curve as a fit function to the actually measured DSC signal (black curve).
Conclusion
With the help of PeakSeparation, overlapping effects can be well separated, allowing for more precise determinaton of the individual thermal effects like melting peaks. The different curve profiles available contribute to the determination of a suitable curve profile for the measured curve. This software feature is easy-to-use and provides added value to the Proteus® analysis software.
The calculated HDPE and PP shares obtained by PeakSeparation with two peaks summarized in Table 2 and the identification using the Identify feature show a very good match with the actual composition. TM-DSC is best known for distinguishing between simultaneously occurring reversing and non-reversing effects (e.g., glass transition and relaxation). However, in this example, temperature modulation is used to precisely reveal the onset of melting which is sometimes difficult to determine visually due to the broad peaks with elongated shoulders to lower temperatures as often seen for polymers. Thereby it was shown that TM-DSC provides a means to improve the prediction quality by refining the analysis range.
Literature
- N. Rudolph, R. Kiesel, C. Aumnate, Understanding Plastics Recycling, 2nd edition, Carl Hanser Publishing, Munich (2020).
- C. Aumnate, N. Rudolph, M. Sarmadi, Recycling of polypropylene/polyethylene blends: effect of chain structure on the crystallization behaviors,Polymers 11 (2019).
- Å.G. Larsen, K. Olafsen, B. Alcock, Determining the PE fraction in recycled PP, Polym. Test. 96 (2021), 107058.
- M. Gall, P.J. Freudenthaler, J. Fischer, R.W. Lang, Characterization of composition and structure-property relationships of commercial post-consumer polyethylene and polypropylene recyclates,Polymers 13 (2021).
- W. Camacho, S. Karlsson, NIR, DSC, and FTlR as quantitative methods for compositional analysis of blends of polymers obtained from recycled mixed plastic waste, Polym. Eng. Sci. 41 (2001) 1626-1635.
- A. Manivannan, M.S. Seehra, Identification and quantification of polymers in waste plastics using differential scanning calorimetry, ACS Div. Fuel Chem. Prepr. 42 (1997) 1028-1030.